

Author|James Fennessy
Source: www.mediavillage.com, July 2020
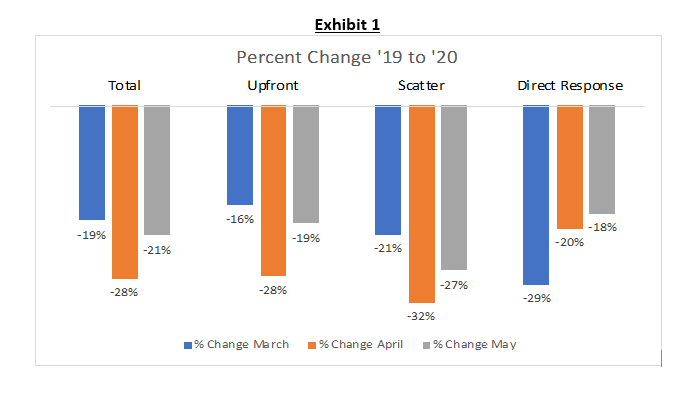
May Highlights —The national TV marketplace rebounded to some degree in May, but year to year declines are still material. Overall, total national TV declined 21% in May (exhibit 1), a 7-point improvement from the 28% decline in April. The improvement was most prevalent for Upfront, improving 9 points from April. Scatter’s rate of decline improved by 5 points.
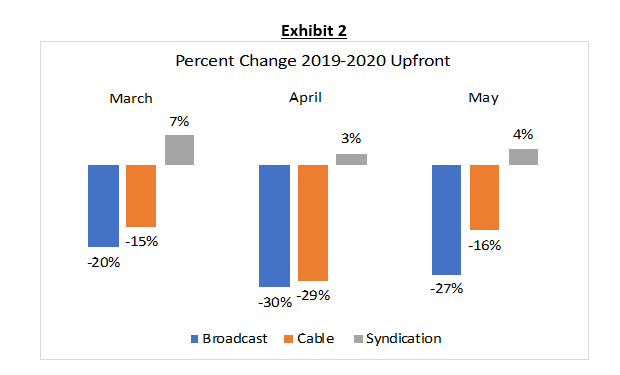
For Upfront spending (exhibit 2), Cable showed the greatest improvement from April, improving 13 points from April’s decline. Broadcast’s improvement was more moderate, only 3 points.
For scatter spending (exhibit 3), the situation was exactly reversed. Broadcast showed the greatest improvement from April, improving 20 points from April’s decline. The decline in the Cable scatter market stayed consistent with April.
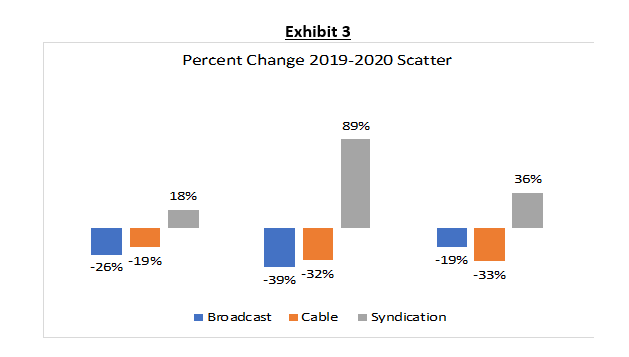
Note: Syndication Scatter is relatively small, making up only 15% of total syndication ad spend.
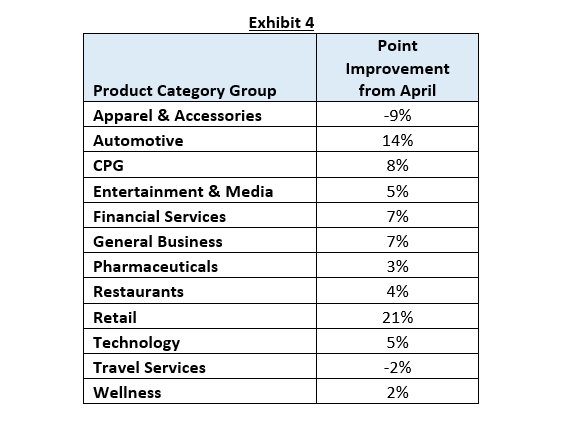
The improvement in the market in May was widespread, across most key advertiser categories (exhibit 4). Only Apparel & Accessories and Travel Services cut spending more in May than April. 6 major categories spend almost $300 million more on national TV in May than April, showing some increased signs of advertiser optimism. CPG and Retail Categories increased their national television spend by over $60 million compared to April, Entertainment & Media and Technology added over $40 million each, Automotive and General Business added over $30 million each.
March-May Highlights:
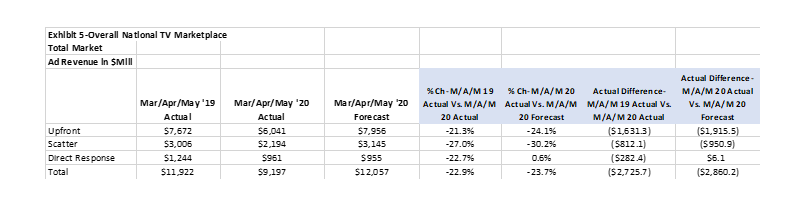
Across all national TV, the market was down over $2.7 billion from March/April/May 2019, and down over $2.9 billion from SMI’s March/April/May 2020 forecast (exhibit 5).For all of national TV, spending was down 23% from last year’s actual spending and 24% from SMI’s forecast.
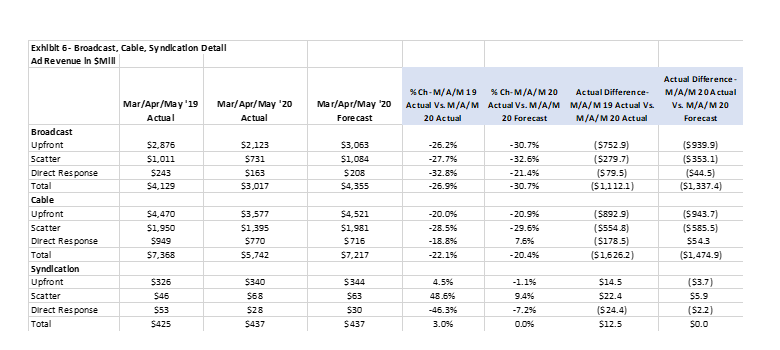
Because of the lack of sports programming, broadcast actually witnessed greater declines for both Upfront and scatter spending than cable (exhibit 6), especially for Upfront spending. And the greater decline for broadcast is a reverse of January/February, where broadcast grew and cable declined, leading to broadcast being down $1.1 billion from last year and $1.3 billion from forecast. Cable is down $1.6 billion from last year, but only $1.5 billion from forecast. Syndication is actually outperforming both March/April/May 2019 and SMI’s March/April/May 2020 Forecast.
As previously mentioned, COVID-19 has materially changed consumer video consumption, with the heightened interest in news and shift of viewing time away from professional sports.
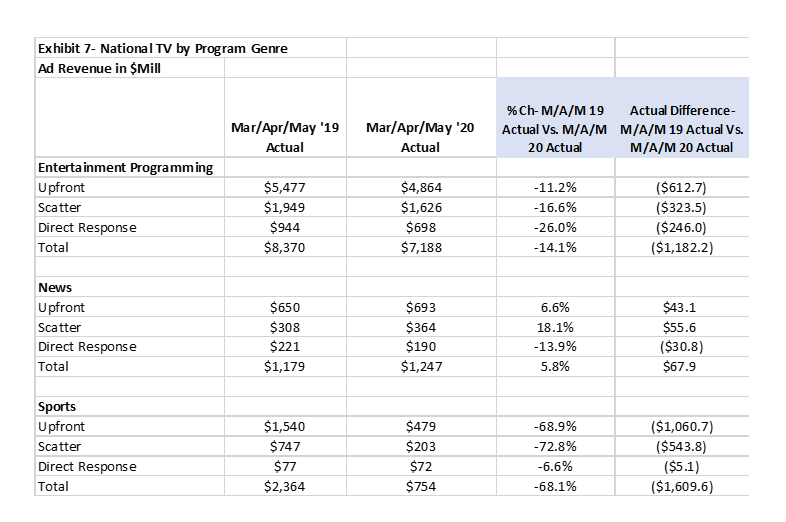
SMI is estimating that there was over a $1.6 billion shortfall in sports ad revenue across March, April, and May (exhibit 7), with approximately two-thirds of that difference due to Upfront and one-third due to scatter.
Overall, the news programming genre is performing well for both Upfront and scatter compared to March/April/May 2019. In spite of having more available GRPs due to higher ratings, the entertainment genre is down 14% compared March/April/May 2019, depressed because of the overall market decline. As SMI has shown in their standard releases, advertising in Entertainment programming, as a share of total, has grown.
Aside from national TV, SMI has line of sight to ad spending on digital video and social. There is interest in the industry in terms of how those media are faring because they have shorter commitment periods and some platforms, especially Connected TV, have seen dramatic consumption growth since the onset of COVID-19.
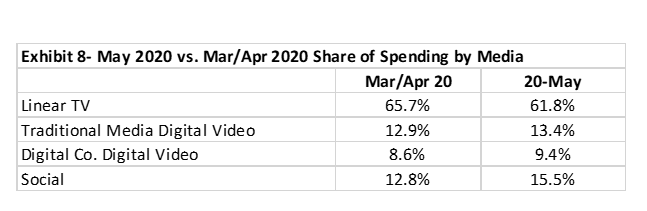
From a share perspective, March/April had witnessed a material change in share for digital video from digitally centric companies and social. In March/April those platforms commanded a combined 22% share of national media spend, up 3 points from 2019. And while spending on digital video from traditional media companies grew slightly, that growth wasn’t enough to offset the decline in linear TV spending. Those trends continued in May, with Linear TV falling to 61.8% share, down nearly 4 points from March/April 2020. Social was the biggest beneficiary of linear declines (exhibit 8)..
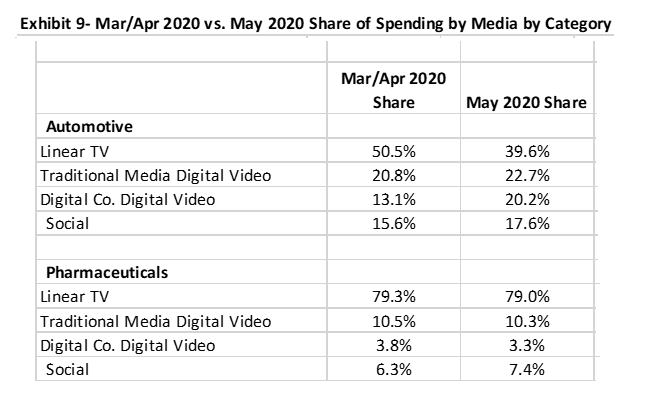
The shift of share away from traditional media companies to digital video from digitally centric companies and social continued for Automotive, moving an additional 7 share points to digital video from digitally centric companies and 2 points to social (exhibit 9). In contrast, Pharma kept share relatively flat in May compared to March/April.