

Author|Bill Harvey
Source: www.mediavillage.com, May 2021
As we all know, the big consumer technology companies include Samsung, Apple, Microsoft, Google, Dell, HP, Lenovo, Motorola, Panasonic, Asus, Bose, Sonos and Seagate, among many others. Courtesy of Standard Media Index (SMI) in this article we will be looking at the ad spend pattern of all of these companies combined.
Before the recent slide in numbers attributed to COVID-related panel maintenance problems, Nielsen in Q3 2019 showed total time spent each day by American adults being 11 hours and 54 minutes of TV usage, some of this being on devices other than the TV set, and some of it being game playing through the TV screen. That is a hair short of being 50% of all time per day including sleeping. An astounding number.
Even without looking up Nielsen numbers, it would take a very non-observant person not to notice the love affair between human beings and their consumer tech. This is not limited to the young, and in fact total usage levels increase rather than decrease with age, peaking at 50-64 where the Nielsen Q3 2019 number is 13 hours and 10 minutes per day.
When I was a pup in the business four hours of TV usage per day was what Nielsen was reporting per U.S. adult.
Consumer tech is much more than TV, of course. The Smartphone rivals the wallet in what you won’t leave home without. It’s the do-all gizmo which if implanted rather than carried would make us cyborgs, maybe coming soon. Even implanted it could scarcely be depended upon more than it already is.
Then of course there are music systems, wearable devices, videogames, smart cars and smart home devices, digital assistants (including Alexa et al), new AR/VR platforms just beginning to flower, drones, biometrics that measure our brain and give us advice just over the horizon.
It’s a good bet that consumer technology has a great future.
As recently as 2016, it didn’t look that way. 2016 consumer tech sales in the U.S. were up only 1% over 2015.
Then in 2017, the vertical entered a sustained growth period. Sales year over year (YOY) were up 11.9% in 2017, 10.1% in 2018, 6.1% in 2019, and despite COVID up 6.3% in 2020. Whether it would have been higher or lower without COVID we’ll never know, although if double digit growth resumes when the pandemic ends it will suggest that COVID did slow consumer tech down.
Consumer tech companies appear to have woken up to their good fortune pretty quickly as they increased their U.S. ad spend +63.2% in 2018 over 2017. They were on the ball, realized that they were in a new expansion phase, and were smart enough to realize that increased advertising would help them capitalize on it.
In 2017 these companies aggregately put most of their money in digital (56.6%) and TV (34.0%). However in 2018, the year they upped their ad spending enormously, the percentages shifted in favor of TV, which grew at +115.4%, to make the year 2018 ad spend almost equally balanced between digital (46.3%) and TV (44.9%), where it has been ever since. In some quarters like Q1 2020, TV was slightly higher (49.9%) than digital (44.2%).
Over most of this period since the 2017 growth cycle began, these tech companies used a decent amount of out of home media, peaking in 2019 at 7.3% of ad spend. In Q1 2021 outdoor was still at a respectable 4.4%.
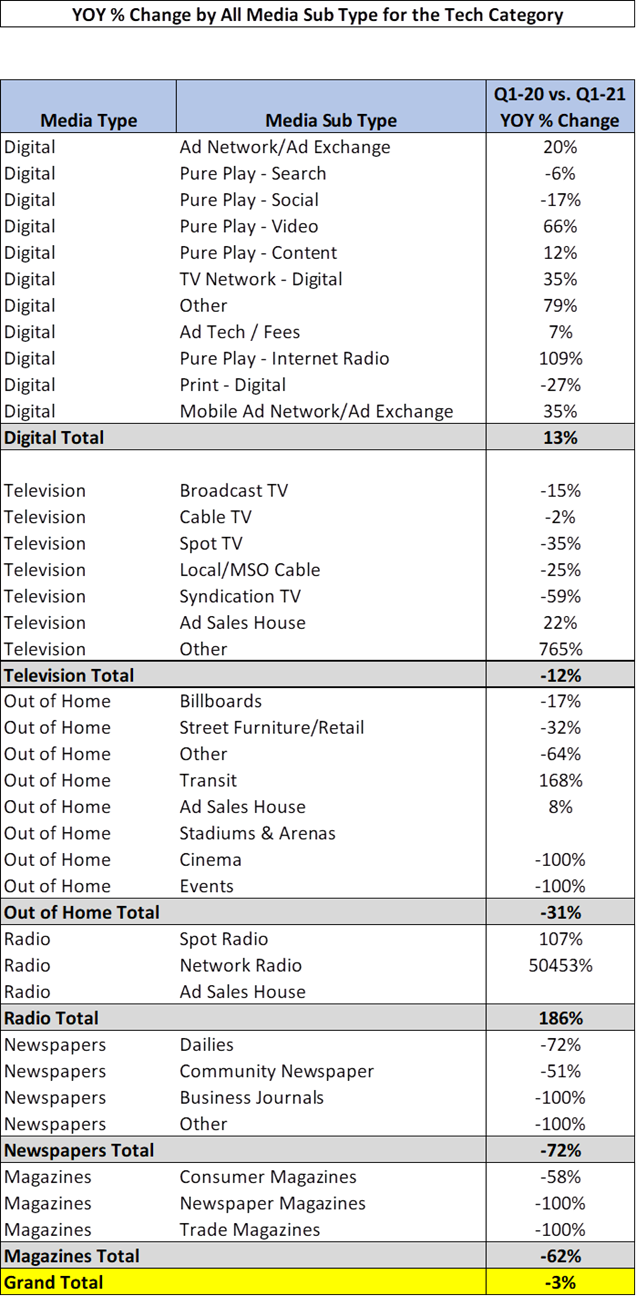
Radio, magazines, and newspapers were never much more than about 1% of the budget each, however as print continues to shrink (newspapers and magazines each 0.2% in Q1 2021), radio has grown +186% Q1 2021 vs Q1 2020, to account for a 1.1% share of ad spend.
 LEARN MORE
The consumer tech category will continue to grow, leading the market for all goods and services, probably for the rest of our lifetimes and maybe beyond. They have settled upon a media strategy about equally balanced between TV and digital, but continuing to test the other media at very low levels. Radio tests appear to have been recently successful judging from the current jump in spending there.
If you are a media company looking to increase your share of consumer tech ad spend we recommend you gather ROI evidence by means of case studies with these brands. The table below shows that they have a willingness to make changes in their media, probably a lot of it based on evidence.
Click the social buttons to share this story with colleagues and friends.
The opinions expressed here are the author’s views and do not necessarily represent the views of MediaVillage.com/MyersBizNet.