
In a time of extreme change through technology in our transportation systems, understanding traffic patterns is key to designing the solutions of tomorrow, says Citilabs CEO Michael Clarke.

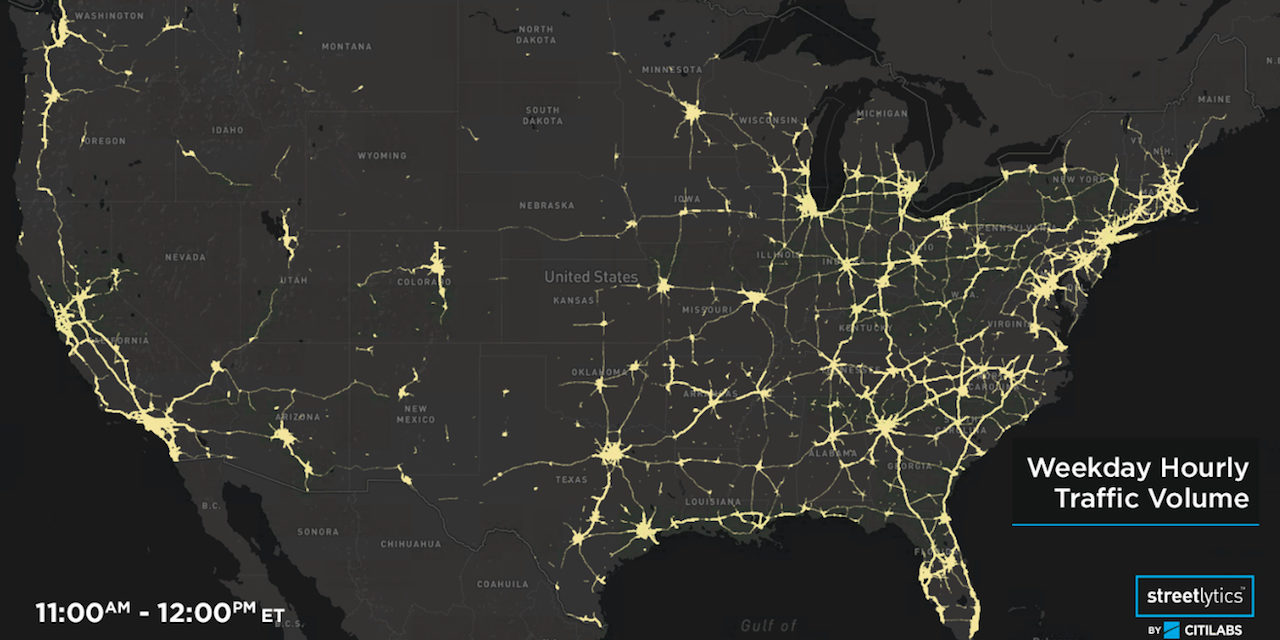
Mobility data provider Citilabs has created what it claims is the first comprehensive map of hourly traffic flow in the U.S.
Dubbed Streetlytics, the data visualization tool leverages information from billions of data points to measure and paint what Citilabs CEO Michael Clarke says is the “most complete picture of the moving population.” In addition to hourly details of where traffic is coming from and going to, it also shows traveler demographics based on derived home locations.
Asked if there is any value for either multi-location businesses or even independent small-to-medium sized businesses from Streetlytics’ hourly traffic map, Clarke emphasized that “Streetlytics is much more than an hourly traffic map.”
“It does provide the directional volume of vehicles and people moving along every street in the US by hour and type of day (weekdays, Fridays, Saturdays and Sundays), but it also tells business where those people live (and the associated demographic information such as income, size of household and many other attributes), as well as where those people are coming from and going to and why they are traveling (commuting to work, for example),” Clarke said.
Streetlytics also compiles the routes that people take, he added. So, for a business, let’s say a doughnut chain, Streetlytics can identify the road segment where you find the maximum number of the target market that does not currently drive within, say a quarter-mile, of one of their existing locations and/or their competitors.
“Nothing like that has existed until now—determining location based on the flow of the target market down the streets, not simply based on where the target market lives,” Clarke said.
In terms of who Streetlytics data, which hows the intensity of traffic volume on roadways in the continental USA by hour for an average work day, the underlying data and insights are applied today in advertising, insurance, real estate, retail, investment and new mobility solutions.
Hugh Malkin, director of Business Development, offers this explanation of the tool’s value: “Since Streetlytics provides the routes used for every vehicle trip, it is also a great base line or control to measure the impact of new technologies around smart cities on every road in the US. These averages can help businesses, startups, and governments spot anomalies in the new technologies they are testing to help them learn and get better faster.”
“Another example of how this information is important is that it tells businesses not only the number of people that pass in front of or near their location but the detailed characteristics of those travelers,” Clarke noted. “That is important information for helping business to align their product breadth, depth and assortment with the drive by population and for use when comparing against in-store transactional data.”
Smart Cities On The Road
The information from Streetlytics could help spur projects around the “smart cities” concept for businesses, tech companies or municipal planners, Clarke said.
In explaining the underlying value of Streetlytics to those constituencies, Clarke offered this analogy: If you were considering opening a restaurant, you would want to understand the market for your restaurant.
But the bigger question you would have would be “Does the demand exist and does it match with what your restaurant will serve?”
When planners, businesses and tech companies consider where to put a road, a transit line, a bike path or, say, to initiate some kind of new mobility service or smart concept—they really have no clear understanding of the demand—how many people are going to and from every part of the city, by hour by day, Clarke said.
“Streetlytics provides a comprehensive view of travel demand. It tells a provider or planner how many people travel from say Riverdale to Tribeca, or Hoboken to Wall Street hour by hour and the characteristics of those people,” he said. “That’s valuable information for planners who want to have a clear understanding of not just where they have traffic jams or crowded subways, but where those people are coming from and going to so that solutions can be found that serves that market and alleviates the problem.”
“In the same way, it provides a clear understanding of the market for private enterprise to serve that demand with evolving mobility services – does this make sense for us to create such a service – what is the size and characteristics of the market?” You can think of many examples where Streetlytics can improve the ‘smartness’ of cities such as much more efficient ways of operating services and infrastructure on a daily basis, to where you should spend your maintenance budget to give the best bang for the buck,” Clarke said.